Springer and “Map Functions” by Professor Krzywicka-Blum
“Map Functions” of Professor Krzywicka-Blum has been published by the prestigious Springer Publishing. The publisher had to receive permission from Queen Elizabeth II.
The most important thing you have done is…
I should say that it’s the book about map functions, but no – the most important thing is the sonorous digitizer, i.e. the sonorous map for the blind.
So a map after all, though using sound.
Yes, and this is something which me and my colleagues can be proud of, although I have to stress the idea was mine. I invited some blind people to take part in the project. They were blind from birth which meant they don’t even have partial vision, or any memory of things, colours or shapes.
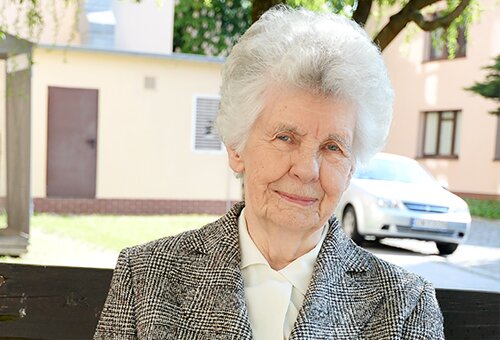
fot. Tomasz Lewandowski
Which means that they have their own, different perception?
Research is usually conducted on children who were previously able to see and not those who have always been blind. Moreover, this second group is very small and completely unrepresentative when it comes to age. We cooperated with a centre in Owińska where there is a well-organized first stage consultancy for parents with blind children from the Wielkopolskie Voivodship. They have on basic rule: their patients have to learn to function in everyday life, manage on their own and find a job.
Is the sound map an outcome of your musical interests?
I played the piano when I was a child but my father thought that I would never become a great pianist so I don’t think this influence was crucial. Simply speaking, musical notation works in such a way that when the notes are high on the stave, the singer sings high and if they are low – lower. Following this course, we made an electronic desktop but you have to hit a point with the mouse for a sound to be heard. I have mathematical background and although later I got interested in cartography, I still have mathematical approach to maps which is apparent in my book – I look at them a little differently from geographers.
How?
Like electronic engineers at field and position. For me, every sign on the map has its place and each such place can be encoded with points, like a picture. And this is what my idea was all about: depending on moving the cursor along the coordinates the sounds were increasingly louder and increasingly higher. The map has, for example, encoded borders of Poland. The whole field is silent and only when you go on a point which lies on the border a sound will be heard. The map starts singing what the sound shows and that’s why it’s called sonorous.
Let’s make it more precise: if there were mountains on the map, the sounds went higher?
Exactly – they squealed. We have patent applications pending. People from China and England are really interested. In Poland – a little less.
And what voice does the map have?
Computer voice. I thought about coding the sounds with instruments but I didn’t make it on time.
Is music mathematics?
No, but they are connected in human mind. It’s just a similar area in the brain. But maybe we’ll talk about my book?
Of course. You have published 108 different works in the field of mathematics, cartography, geodesy…
I come from Lviv where Eugeniusz Romer worked and we all learn using his maps. If somebody says “lowland”, they know that it’s green on the map. And this was Romer’s idea because, for example, the Swiss do not draw maps this way. Just as I used sounds for my map for the blind, Romer used colours. That’s because the hardest task is to show the difference in altitude on a flat map. And Romer made a certain discovery and introduced it for practical use. Tell me, which colour denotes danger?
Red.
And why?
Because it’s distinctive?
Because it’s closest to the eye. Mountains are brown, highlands are yellow, lowlands – green and there are also blue and purple. And this is the height scale and wavelength which Romer took advantage of. He took this model from experience and the theory was fitted later. And the map itself appeared long ago because humans needed it. When I was head of one of the International Cartogrphic Association committees I listened to a lot of discussions what map is, what its definition is and what changes new technologies bring into maps, for instance the computer. But regardless of the definition and tools one thing does not change – map’s usefulness. Humans need it and even those who can’t read or write are able to read a map. And they won’t get lost if they have it.
Map of Moscow from 1610 made by a Polish spy fot. Wikimedia
Why?
Because they observe the map with their eyes and our eyesight delivers over 80% of stimuli. They are registered and remembered. A man can remember the sight, contrast, shape, colour – lots of things. Geometry is also important – we need visual order to move around, a tree on the left, a house on the right, something in the background, something at the front. This is how we move and this is how our brain remembers. Maps tell us what the world looks like, however they don’t show everything but only what’s important. When I was in primary school, I knew that the kiosk where you buy chocolates is on the right. Today, I don’t remember what tenements looked like but I remember that kiosk. Because it was important and useful to me. The aim of the map is what counts – man started drawing it to show another man where to go but also to show ownership. Old maps were very vivid.
But the map was changing over the centuries.
And the 19th century saw the emergence of cartography. But also today maps are relevant in many branches of science. Hugo Steinhaus, who was my friend and who reviewed my doctoral thesis, told me that mathematics puts things in order. But it orders just like my coordinates where I can encode the map with points. It was Steinhaus who showed me the dependence of the parking phenomenon characterizing chromosome sequences and heredity. Profound science sometimes needs simple associations, especially as great discoveries are usually accidental.
How have maps developed over the centuries?
Their evolution is strictly connected with their use. There were sailing maps, soldiers first had table maps and later photographic ones. In Wrocław, in one of the libraries, there is the Silesian Atlas – a collection of maps ordered by Wrocław townspeople. Cartographers who made them – Wieland and Schubarth – travelled around all duchies and painstakingly drew gold and silver mines plus various other important things in a given duchy. On every map there is of course a key explaining all these pictures and signs on the map. But these keys show us just how much we can read from these old maps.
And what CAN we read from them?
Researching only these map keys I came to the conclusion that in the Sudeten there was well-developed sheep farming and there were many roads leading to the south of the region. And that below the mountain range people produced beautiful canvas later sold in Belgium. And I analyzed only rare cases. When I grouped them, I noticed that the economy of Karkonosze in the times of Schubarth was very similar to that from the Żywiec region but half a century later.
Maps of Silesia made by Wieland and Schubarth fot. Wikimedia
You learnt about economic development from the map?
Of course. After all, someone placed on the map a mill from which he would collect tax. But it turned out that you can’t put all the information on the map so it was divided into background and content, for example geological. Along with this elaboration came the great theory of cartography and, at the same time, mathematicians came up with differential geometry and showed that you can’t draw Africa on a flat piece because the Earth isn’t flat. And, on one hand they made extremely precise measurements in order to fire a gun or cross a river but on the other, the coastline was too generalized. Now, when we have satellites, the scale paradigm is not so important any more. Information systems occurred – coordinates, reference points...
And what important things are there in a book about map functions?
Remember that scale is important because it makes a difference if I draw a house as a dot or a square, if we put a tree or a well on the map or not. This depends on the significance of what we describe and our aim. In order to measure a garden, because a Smith is quarrelling with his neighbour, we have to take a 1:500 scale map. It’s precise and there’s no curvature because it’s a small piece of land. But when you have to measure 600 hectares, the situation is completely different. On a hydrological map every spring is important and on a geological map it’s not. And that’s why, depending on the function we select what’s called a reference unit.
In your book one can also see a map of the foot.
As I’ve already said, we can place different things on the map. In the International Cartographic Agency I dealt with population groups for which there are almost no maps: Eskimos, rare languages or religions. To show such a community on a map is a real challenge.
So you’re a humanist.
Yes. I went into mathematics only because a had a choice between Astronomy and Mathematics. My father was a judge before the war so it was a miracle that I was admitted at all. (After World War II in communist Poland it was difficult for people with pre-war intelligentsia roots to get a good job or a place at a university –[ translator’s note]).
So how did you survive?
I like logic. And I went on from Mathematics to Geodesy and Cartography at the AGH University of Science and Technology (in Cracow). At the teaching faculty girls dominated during the first three years. But later there was an MA course and there were only eight places at four universities – in Lublin, Lodz, Torun and Wroclaw. I was one of those eight people, though I must admit that mathematics never interested me much – it’s too dry. After the University I worked for a few years at the Wroclaw Polytechnic but I was offered a place at the University School of Agriculture where the Faculty of Geodesy was being established. And that’s how I got into cartography. These interests are also reflected in my recent book. It concerns paper maps. In the first chapter I present the history of cartography. Next, I explain that, in order to become a branch of science, cartography had to obtain research subjects and methods. And here there was a problem because it is difficult to come up with a description of either o these things. Only in the 20th century did a Frenchman called Bertin characterize semiology of graphics and distinguished graphic variables. There are seven of them including direction and colour. It led to the formulation of rules for creating map graphics. In the following chapters I matched map functions to the dimensions of graphic sign reference units on a map, distinguishing point, linear and surface signs. Today there’s no such discipline as cartography. There is geodesy and cartography. In Chapter 2 I present the functions of point sign.
For example?
There’s Florian Czacki’s map of the Vistula. Now we know, of course, where this river flows because we have satellite data. But we don’t know where it was in the 18th century. And how can we know? From an old and wrong map. But in order to make a good up-to-date map out of it, I have to choose several points.
Administrative division of the Duchy of Legnica on Wieland’s map fot. Wikimedia
What points?
We have to choose a well in an old castle because it has been in this place since it was dug. And in the past crossroads were used and crossroads have changed. Constant points are those which have not changed for hundreds or even thousands of years. A well, an old tree. And we put those constant points on a new map, scale it using contemporary means, we stretch here, we squeeze there and we have a comparison because we can see the changes.
Do you have any favourite map?
I’m not in love with maps, though I have a lot of them in my study – some of them really beautiful. There are African ones – with nice graphics and animals. Once I was surprised by a map which I got in Australia. I couldn’t understand it and only after more careful analysis it turned out that while our maps are oriented north – Scandinavia up, Britain left – they have it the other way round. I had to find the Italian Boot to see what they drew there. And coming back to my book...
Yes.
In Moscow near Kremlin I saw a big stone near the church with an engraving commemorating Russian victory over Poles. And in my book there’s a map drawn by a Polish spy. He had got into Moscow, sat there for a year and drew the whole city. And then he gave his drawings to the army. It was 1610 and the Poles went in through the gates he had shown them. This is anamorphosis which means that the map is not scaled but only has roads used by the army because they are important. When The Poles conquered the city, they burnt Kitaj Gorod and then rebuilt everything. Equally interesting is the Roman Map of their conquests in Europe – it’s on the Roman Forum, drawn on a stone. And, frankly speaking, the orientation of points is wrong there because the important thing was which way the legions where supposed to go and where camps were supposed to be set up. I’m talking about points which are vital for maps – they help, for example, understand changes in a process. However, linear maps are also important. It’s transport, rivers, hydrology, borders – I write about them in the third chapter of my book. The fourth is devoted to surface – for example, farmlands. I also write about taxonomy. It’s a branch of mathematics but also economics. If I want, for instance, to analyse land prices, I have to know what they depend on, how far they are from the centre, what buildings there are and if there are any green spaces. These elements influence the price of a square meter.
How did it happen that “Map Functions” was published by Springer?
First I wrote the book in Polish but when the present pro-rector Jarosław Bosy read it, he said that it has to be published in English. I didn’t know that in Springer every scientific book is reviewed by four respected scholars – if I had known that... Anyway, at first they wanted a shorter version but later they decided to publish the book in full. But the most unusual thing is that the publisher had to get a permission from the Queen of England, among other people.
Why?
Because I write about maps, and in the past they were very interesting for all kinds of spies. And Queen Elizabeth II gave that permission.
This site uses custom cookies to ensure that it functions properly. Some are necessary for the page to run, so will always remain active. These cookies will store information about the user's cookie settings. In addition, third-party cookies are used for external tools. For more information see the privacy policy.
Purpose
Enables storage (such as cookies) related to advertising.
Agreed
Sets consent for sending user data to Google for online advertising purposes.
Agreed
Sets consent for personalized advertising.
Agreed
Enables storage, such as cookies (web) or device identifiers (apps), related to analytics, for example, visit duration.
Agreed
Enables storage that supports the functionality of the website or app, for example, language settings
Agreed
Enables storage related to personalization, for example, video recommendations
Agreed
Enables storage related to security such as authentication functionality, fraud prevention, and other user protection